
Executive Summary & Key Takeaways
Key Insights- Monitor AI quality alongside infrastructure health
- Trace prompts, models, retrieval, tools, latency, cost, and outcomes end to end
- Detect quality and retrieval drift with segmented baselines
- Feed production failures back into regression tests and release gates
Quick Definition / Direct Answer
Direct SummaryEnterprise AI observability correlates model, prompt, retrieval, tool, application, and business signals so teams can detect and explain production failures. This article focuses on monitoring and diagnosis; for production reliability validation and failure prevention, see https://acadifysolution.com/blogs/post/ai-reliability-testing-enterprise-ai.
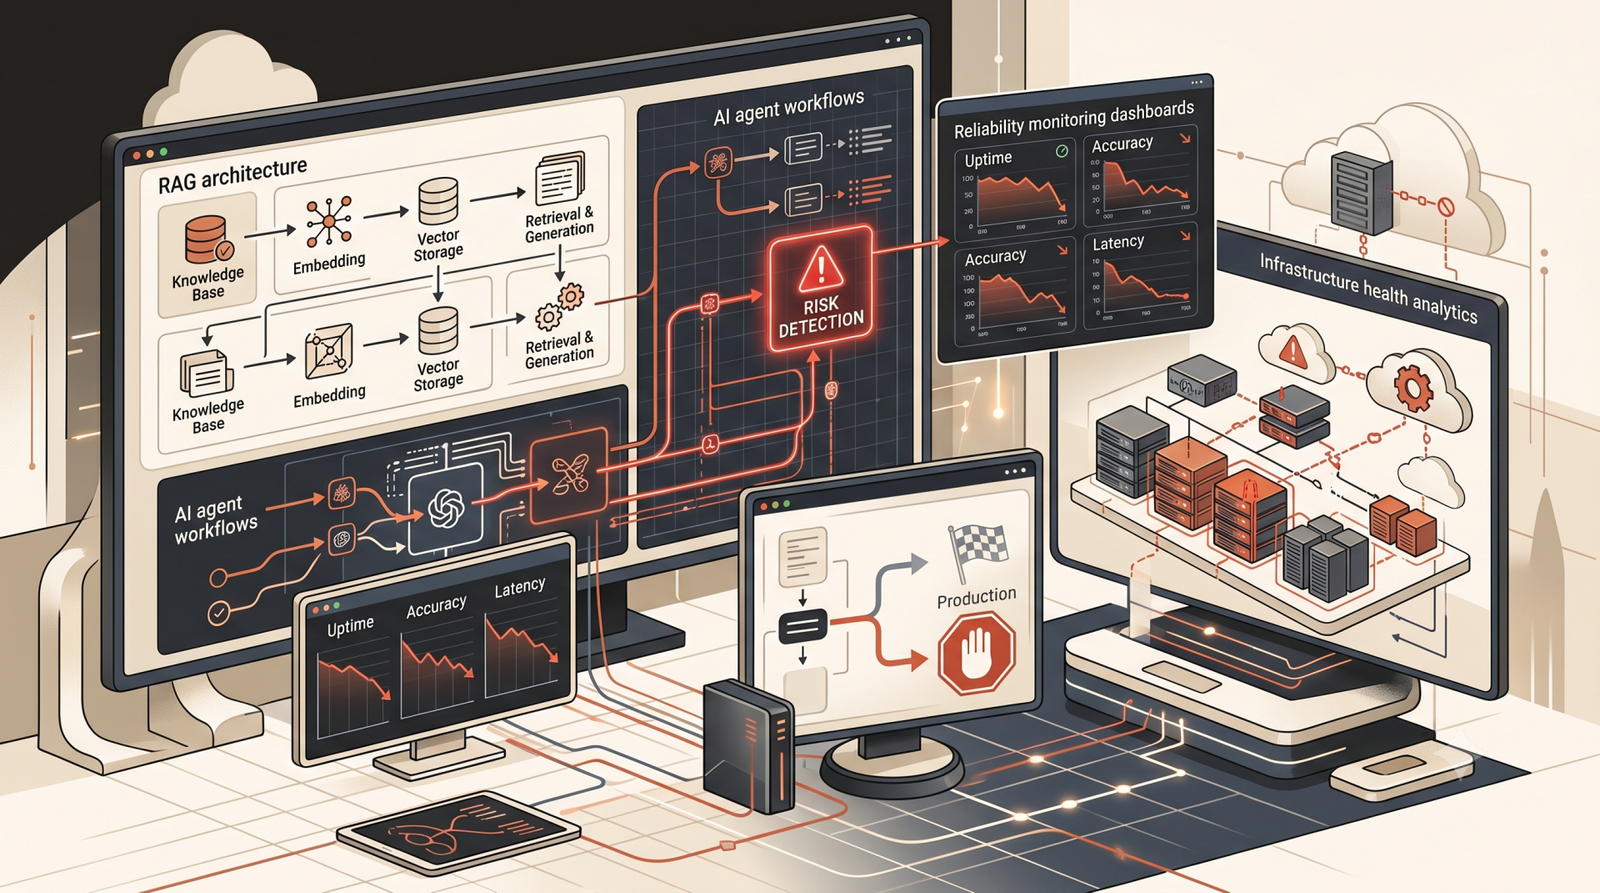
Enterprise AI systems can pass functional tests and still fail in production. A model may become less accurate, retrieval quality may drift, latency may spike, prompts may change, or an upstream data source may quietly degrade. This is why production AI needs observability that measures more than uptime and API errors.
Enterprise AI observability is the practice of collecting and correlating signals from models, prompts, retrieval pipelines, tools, applications, users, and business outcomes so teams can detect, explain, and correct AI failures in production.
Why Traditional Application Monitoring Is Not Enough
Traditional monitoring answers questions such as whether a service is available, how much CPU it uses, and how many requests fail. AI systems introduce another layer of uncertainty: the application can remain technically healthy while the answers become wrong, incomplete, unsafe, or inconsistent.
Need AI or Software Engineering Support?
Turn your ideas and technical challenges into reliable, scalable solutions with Acadify. From AI development and automation to software engineering and product development, we help businesses build and grow with confidence.
An enterprise AI observability strategy therefore needs to connect infrastructure telemetry with AI-specific quality signals and the context required to investigate a bad response.
What Should Enterprise AI Observability Measure?
1. Model quality
Track task-specific metrics such as correctness, groundedness, relevance, refusal quality, and structured-output validity. The exact metric should follow the production use case rather than a generic benchmark.
2. Retrieval quality
For RAG systems, observe retrieval hit rate, ranking quality, citation coverage, context utilization, and the frequency of answers generated without sufficient supporting evidence.
3. Prompt and configuration changes
Record prompt versions, model versions, system instructions, routing decisions, sampling settings, tool definitions, and policy changes. Without versioned context, debugging becomes guesswork.
4. Latency and cost
Measure end-to-end latency as well as model inference time, retrieval time, tool-call time, token usage, and cost per request. This helps teams distinguish a model problem from a slow dependency or inefficient workflow.
5. Safety and security signals
Monitor policy violations, suspicious tool calls, prompt-injection indicators, sensitive-data exposure signals, and unusual changes in behavior. Security telemetry should be linked to the same trace used for application debugging.
6. Business outcomes
Connect AI responses to measurable outcomes such as resolution rate, escalation rate, conversion, deflection, processing time, or human-review rate. A technically stable system can still be business-negative.
AI Tracing: The Core of Production Debugging
A useful AI trace represents a complete request journey rather than a single API call. A trace can include the incoming request, prompt version, model invocation, retrieved documents, reranking, tool calls, guardrails, final response, latency, cost, and outcome.
This makes it possible to answer a critical production question: Why did this particular answer happen?
A Practical Observability Architecture
A production-ready design can separate telemetry collection from analysis. Application and AI components emit structured events into a telemetry layer. Traces, metrics, and logs are then correlated and routed to dashboards, alerting, quality evaluation, and incident workflows.
Client
  -> AI Application
      -> Guardrails
      -> Router
      -> Retriever / Reranker
      -> Model
      -> Tools
  -> Response

Telemetry from every stage
  -> Traces + Metrics + Logs
  -> AI Quality Evaluation
  -> Alerts + Dashboards
  -> Incident / Review Workflow
How to Detect AI Quality Drift
Quality drift rarely appears as a single obvious error. Instead, several weak signals may move together: lower retrieval relevance, more fallback answers, longer context windows, higher escalation rates, and declining user feedback.
Teams should establish baselines for important production slices and compare current behavior against them. Segmenting by use case, model, prompt version, customer type, language, and retrieval source often reveals problems hidden by global averages.
What to Put on an Enterprise AI Dashboard
| Area | Useful signals | Why it matters |
|---|---|---|
| Reliability | Error rate, timeout rate, availability | Detect service failures |
| AI quality | Correctness, groundedness, relevance | Detect bad outputs |
| RAG | Retrieval hit rate, reranking quality, citation coverage | Diagnose retrieval failures |
| Performance | Latency by stage, throughput | Find bottlenecks |
| Cost | Tokens, cost/request, cost/use case | Control AI economics |
| Safety | Policy violations, injection indicators | Reduce operational risk |
| Business | Resolution, escalation, conversion | Prove business value |
Common Enterprise AI Observability Mistakes
Only monitoring infrastructure
Green servers do not prove that an AI system is producing useful answers.
Logging everything without structure
Large volumes of uncorrelated logs create noise. Events need stable identifiers and relationships between traces, prompts, models, tools, and outcomes.
Ignoring version context
A production incident is difficult to reproduce when teams cannot identify the exact prompt, model, retrieval configuration, or policy version that generated the output.
Using a single quality score
One aggregate score can hide regressions in specific workflows or customer segments. Multiple targeted signals are more actionable.
Implementation Roadmap
- Define critical AI journeys. Start with the highest-risk and highest-value workflows.
- Standardize trace IDs. Carry one correlation identifier across application, retrieval, model, and tool layers.
- Capture version metadata. Store model, prompt, policy, tool, and retriever versions with each trace.
- Add AI quality evaluation. Use deterministic checks and sampled human or model-assisted evaluation where appropriate.
- Create thresholds and alerts. Alert on meaningful changes in quality, latency, cost, and safety—not every minor fluctuation.
- Connect incidents to feedback. Turn production failures into regression cases for pre-release testing.
How Observability Connects to AI Testing
Production observability and pre-production testing should form a closed loop. Observability reveals real failure patterns; those failures become evaluation cases; the resulting test suite becomes a quality gate for future releases.
Frequently Asked Questions
What is the difference between AI monitoring and AI observability?
Monitoring primarily watches known signals and thresholds. Observability provides enough correlated context to investigate why the system behaved a certain way, including the model, prompt, retrieved context, tools, and downstream outcome.
Do RAG systems need special observability?
Yes. RAG adds retrieval and ranking steps whose failures can directly affect answer quality. Observability should expose which sources were retrieved, ranked, passed to the model, and cited where applicable.
How often should enterprise AI quality be evaluated?
Continuous production sampling is preferable for critical systems, combined with deeper evaluation at release boundaries and after material changes to models, prompts, data, routing, or policies.
Key Takeaway
Enterprise AI observability is not another dashboard project. It is the operational layer that connects AI behavior to engineering signals, quality evaluation, security controls, and business outcomes. The strongest systems make every production failure diagnosable and every important failure reusable as a future test case.
Related practical guides
Primary reference and scope
OpenTelemetry describes traces, metrics and logs as different observability signals. Correlate them with model, prompt and retrieval versions when investigating AI behavior; telemetry by itself does not establish response quality.
Glossary & Key Architecture Definitions
- • AI observability: correlated telemetry and evaluation context used to understand AI system behavior in production.
- • AI trace: a correlated record of the stages involved in one AI request.
- • Quality drift: a measurable degradation or behavioral change in production AI performance over time.
Engineering Research & Citations
- [1] OpenTelemetry documentation for traces, metrics, and logs; NIST AI Risk Management Framework for AI risk management practices. Validate and add direct source URLs during editorial review.
- [2] OpenTelemetry signals: https://opentelemetry.io/docs/concepts/signals/

No perspectives submitted yet. Be the first to start the discussion.